Section 4.2 Averages
Subsection 4.2.1 Measures of Center
People often talk about “averages,” and you probably have an idea of what is meant by that. Now, you will look at more formal mathematical ways of defining averages. In mathematics, you call an average, a measure of center because an average is a way of measuring or quantifying the center of a set of data. There are different measures of center because there are different ways to define the center.
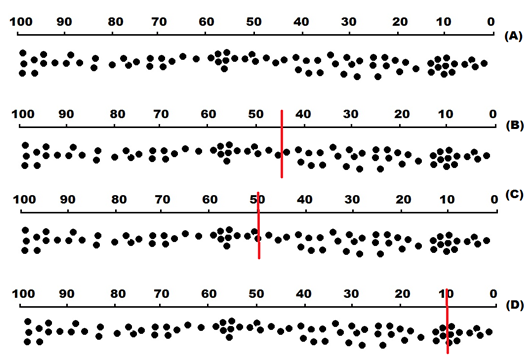
Think about a long line of people waiting to buy tickets for a concert. (Figure A shows a line about 100-feet long and each dot represents a person in the line.) In some sections of the line people are grouped together very closely, while in other sections of the line people are spread out. How would you describe where the center of the line is?
Would you define the center of the line by finding the point at which half the people in the line are on one side and half are on the other (see Figure B)? Is the center based on the length of the line even though there would be more people on one side of the center than on the other (see Figure C)? Would you place the center among the largest groups of people (see Figure D)? The answer would depend on what you needed the center for. When working with data, you need different measures for different purposes.
Subsubsection 4.2.1.1 Mean (Arithmetic Average)
Find the average of numeric values by finding the sum of the values and dividing the sum by the number of values. The mean is what most people call the “average.”
Example 4.2.1. Mean of Whole Numbers.
Find the mean of 18, 23, 45, 18, 36Find the sum of the numbers: 18 + 23 + 45 + 18 +36 = 140
Divide the sum by 5 because there are 5 numbers: 140 ÷ 5 = 28
The mean is 28.
Example 4.2.2. Mean of Decimals.
Find the mean of 1.5, 1.2, 3.7, 5.3, 7.1, 2.9Find the sum of the numbers: 1.5 + 1.2 + 3.7 + 5.3 + 7.1 + 2.9 = 21.7
DDivide the sum by 6 because there are 6 numbers: 21.7 ÷ 6 = 3.6166666666
Since the original values were only accurate to one decimal place, reporting the mean as 3.61666666 would be misleading, as it would imply we knew the original values with a higher level of accuracy. To avoid this, we round the mean to one more decimal place than the original data.
The mean is 3.62
Subsubsection 4.2.1.2 Median
Find the median of numeric values by arranging the data in order of size. If there is an odd number of values, the median is the middle number. If there is an even number of values, the median is the mean of the two middle numbers.
Example 4.2.3. Median of Odd Number of Values.
Find the median of 18, 23, 45, 18, 36Write the numbers in order: 18, 18, 23, 36, 45
There is an odd number of values, so the median is the number in the middle.
The mean is 23.
Example 4.2.4. Median of Even Number of Values.
Find the median of 18, 23, 45, 18, 12, 50.Write the numbers in order: 12, 18, 18, 23, 45, 50
There is an even number of values, so there is no one middle number. Find the median by finding the mean of the two middle numbers:
18 + 23 = 41
41 ÷ 2 = 20.5
The median is 20.5.
Subsubsection 4.2.1.3 Mode
Find the mode by finding the number(s) that occur(s) most frequently. There may be more than one mode.
Example 4.2.5.
Find the mode of 18, 23, 45, 18, 36.Subsubsection 4.2.1.4 Note on terminology
The terms mean, median, and mode are well defined in mathematics and each gives a measure of center of a set of numbers. In everyday usage, the word “average” usually refers to the mean. But be aware that “average” is not clearly defined and someone might use it to refer to any measure of center.
Worksheet 4.2.2 Averages Worksheet
Objectives
Demonstrate an understanding of the connection between the distribution of data and various mathematical summaries of data (measures of central tendency and of variation).
1.
Consider the data set
| 3 | 5 | 1 | 6 | 6 | 2 | 4 | 1 | 4 | 9 | 9 |
Find the mean and median.
2.
Consider the data set
| 9 | 3 | 2 | 9 | 2 | 8 | 6 | 8 |
Find the mean and median.
Problem Situation: Summarizing Data About Credit Cards.
A revolving line of credit is an agreement between a consumer and lender that allows the consumer to obtain credit for an undetermined amount of time. The debt is repaid periodically and can be borrowed again once it is repaid. The use of a credit card is an example of a revolving line of credit.
U.S. consumers own more than 600 million credit cards. As of 2015 the average credit card debt per household with a credit card was $15,863. In total, American consumers owe $901 billion in credit card debt. Worldwide the number of credit card transactions at merchants was over 135 billion in 2011.
Surveys indicate that the percentage of college freshmen with a credit card was 21% in 2012, while 60% of college seniors had a credit card. One-third of the college students reported having a zero balance on their credit card. The average balance carried across all students’ cards was $500. However, the median balance was $136.
At www.creditcards.com it explains that card issuers divide customers into two groups:
"transactors" who use their cards for purchases and pay off the balances each month. Transactors pay off the balance before any interest charges are applied.
"revolvers" who carry balances on their cards, paying interest charges month to month.
The number of people who carry credit card debt, the “revolvers”, has been steadily decreasing in the U.S. since 2009. By 2014 only one-third of adults surveyed said their household carries credit card debt. Fifteen percent of adults carry $2,500 or more in credit card debt each month.
In the first part of this lesson, you will use the information about credit cards given above to learn about some ways to summarize quantitative information.
3.
The population of the United States is slightly more than 300 million people. There are about 100 million households in the United States. Use the information above to find the average number of credit cards per person and the average number of credit cards per household.4.
In the U.S. the average number of credit cards held by cardholders is 3.7. Why is this number different than the average number of credit cards per person you found in the last question?5.
Consider the statement, “Average credit card debt per household with a credit card is $15,863.” What does this statement tell us? (Assume the "average" they're using is the mean)6.
If about 45% of households with credit cards carry no debt, what does that indicate about the amount of debt of some of the other 55% of households?7.
The introduction states that the average balance carried across all college students’ cards was $500. Imagine you ask four groups of six college students what their credit card debt is. The amount of dollars of debt for each student in each group is shown in the table, values listed in order of size. Find the mean and median debt of each group of college students.| Group A | Group B | Group C | Group D |
|---|---|---|---|
| 0 | 500 | 410 | 0 |
| 100 | 500 | 460 | 0 |
| 110 | 500 | 480 | 0 |
| 170 | 500 | 490 | 0 |
| 1000 | 500 | 550 | 0 |
| 1620 | 500 | 610 | 3000 |
8.
Observe the medians and the data values of each of the groups. For each statement below, indicate if it is true for: None of the groups, Some but not all of the groups, or All of the groups.Half of the data values are less than the median. [None] [Some but not all] [All]
Half of the data values are either less than or equal to the median. [None] [Some but not all] [All]
Half of the data values are greater than the median. [None] [Some but not all] [All]
Half of the data values are either greater than or equal to the median. [None] [Some but not all] [All]
Half of the data values equal the median. [None] [Some but not all] [All]
9.
Recall that college students’ credit cards carry a mean balance of $500 while having a median balance of $136. What does this indicate about the distribution of credit card debt among various students? Does one of the Groups in the table have a distribution similar to this?10.
A survey in 2012 indicated that college freshmen carry a mean credit card debt of $611 but the median of their credit card debt is $47. Create a data set of five freshmen students so that the data set has a mean and median that is the same as that of the surveyed college freshmen.Problem Situation 2: Weighted Means.
Sometimes you want to find the mean average of some numbers, but the numbers are not “equally important” or in other words they don’t have the same “weight” or “frequency”. In that case we find the “weighted average” of the numbers.
Example 4.2.9. mean credit card debt:.
Suppose researchers at a small two-year college surveyed students who have credit cards and report the following:
Mean credit card debt of $350 for 114 freshmen surveyed
Mean credit card debt of $285 for 220 sophomores surveyed
If we want to know overall for all the surveyed students what their mean credit card debt was, we cannot simply average $350 and $285 since these numbers are not equally “weighted”. The $350 was an average for only 114 people while the $285 was an average for a larger group of 220 people. The way to find the overall average credit card debt for all students surveyed is to multiply each of the values by its “weight” or “frequency” or “importance” before adding them together, and then divide by the total “weight” or “frequency”.
Conclude: The mean credit card debt of all the students surveyed was about $307
Example 4.2.10. Weighted grade averages in a course:.
Suppose a History course has a midterm, a final exam, and a 20 page report, and the syllabus states they have these weights in determining the final course grade:
midterm - 20%; final exam - 45%; report - 35%.
Kim’s grades in the course were these:
Midterm – 82; final exam – 89; report – 93.
Kim’s final grade in the course is found by the weighted average:
(82(.20) + 89(.45) + 93(.35))/(.20+.45+.35) = 89/1.00 = 89 Kim’s final course grade is 89.
Note: If the grades were not weighted, Kim’s average would be (82 + 89 + 93)/3 = 88
11.
Researchers at Acme groceries studied how long customers had to stand in the check-out line. One day 35 customers spent on average 7.7 minutes each in the check-out line. The next day 24 customers spent an average of 6.5 minutes each. What is the overall average time customers spent in line? Round your answer to two decimal places.12.
Your college GPA is a weighted mean. The grade earned in each class needs to be weighted by the number of credits for the class. Compute the GPA for a student who has earned the following credits:English 101 (5 credits) with a grade of 3.0,
Math 96 (7 credits) with a grade of 3.2,
Public Speaking (5 Credits) with a grade or 3.6,
Chemistry 100 (5 credits) with a grade of 2.7, and
College Success (3 credits) with a grade of 3.8.