Identify when a linear model is reasonable for a given situation and, when appropriate, formulate a linear model. In the context of the situation interpret the slope and intercepts and determine the reasonable domain and range.
In this activity we define a function and develop an understanding of function notation by comparing statements we already understand in English to equivalent statements written in “math” language.
The mathematical concept of a function can be extremely complicated. It took thousands of years to come up with it, define it and formalize it. For example, just look at this definition from Wikipedia 1
You could spend your whole life learning about what a function is and never get to the rest of this book! For this reason we will keep things simple and informal in order to attain a quick and accessible understanding of topics, including functions. Students continuing in mathematics will add to their knowledge of functions as needed and as part of a life-long process.
A function is a rule that takes a piece of “usable” information that you choose (input) and gives you some kind of result (output). By “usable” we mean information that has meaning for the function.
Think of a function as a sort of machine. Using some input, the machine does something to the input and then out pops a result. In this course our inputs will be mostly numbers and the process will yield numbers as results.
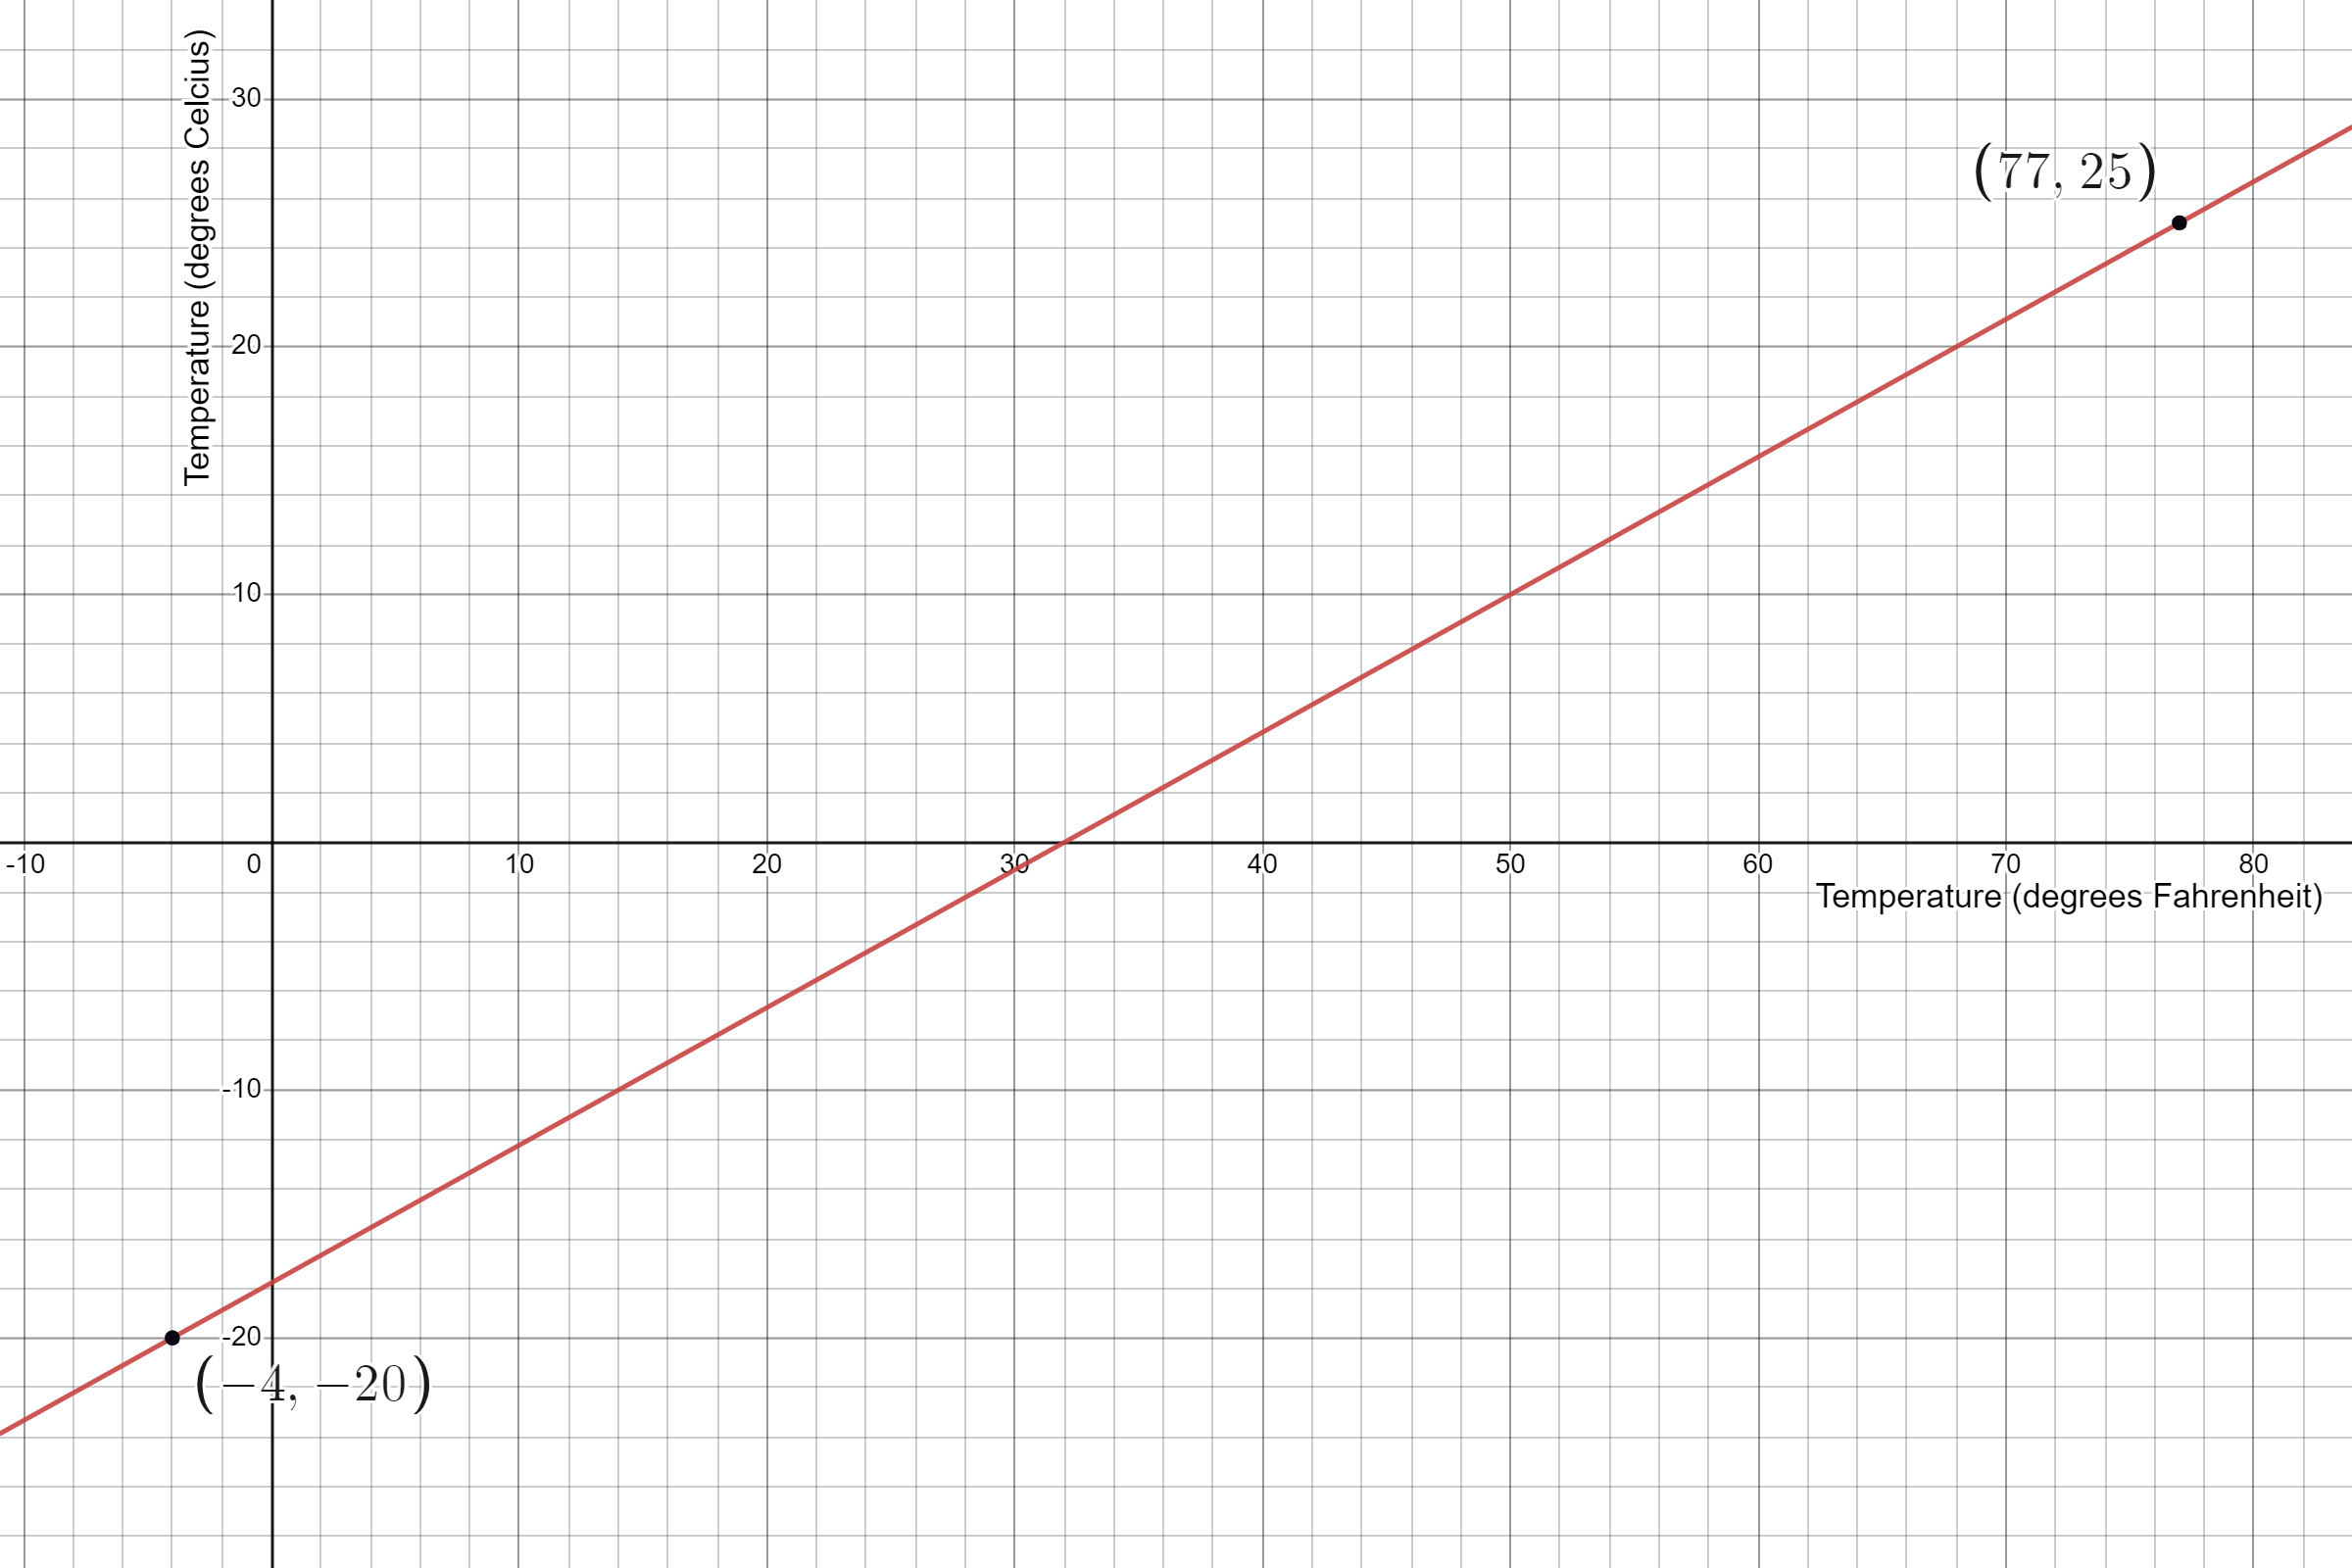
What kinds of inputs can the function use? The temperature function in the previous exercise could only accept temperatures between \(-60\) and \(110\) degrees Fahrenheit. The input of \(150\) degrees \(F\) is not usable because it is not available to choose.
Math is just another language. We use it to communicate measurements, changes in value and how things are related to or affect one another. Almost everything you say or describe in Math, you can say or describe in English.
In this next exercise we learn to communicate the position of a train as time passes and develop the notation to express where the train is at different times. We will assume that this train runs on time, every day and the conditions every day are the same. You know, an alternate universe called “example land”.
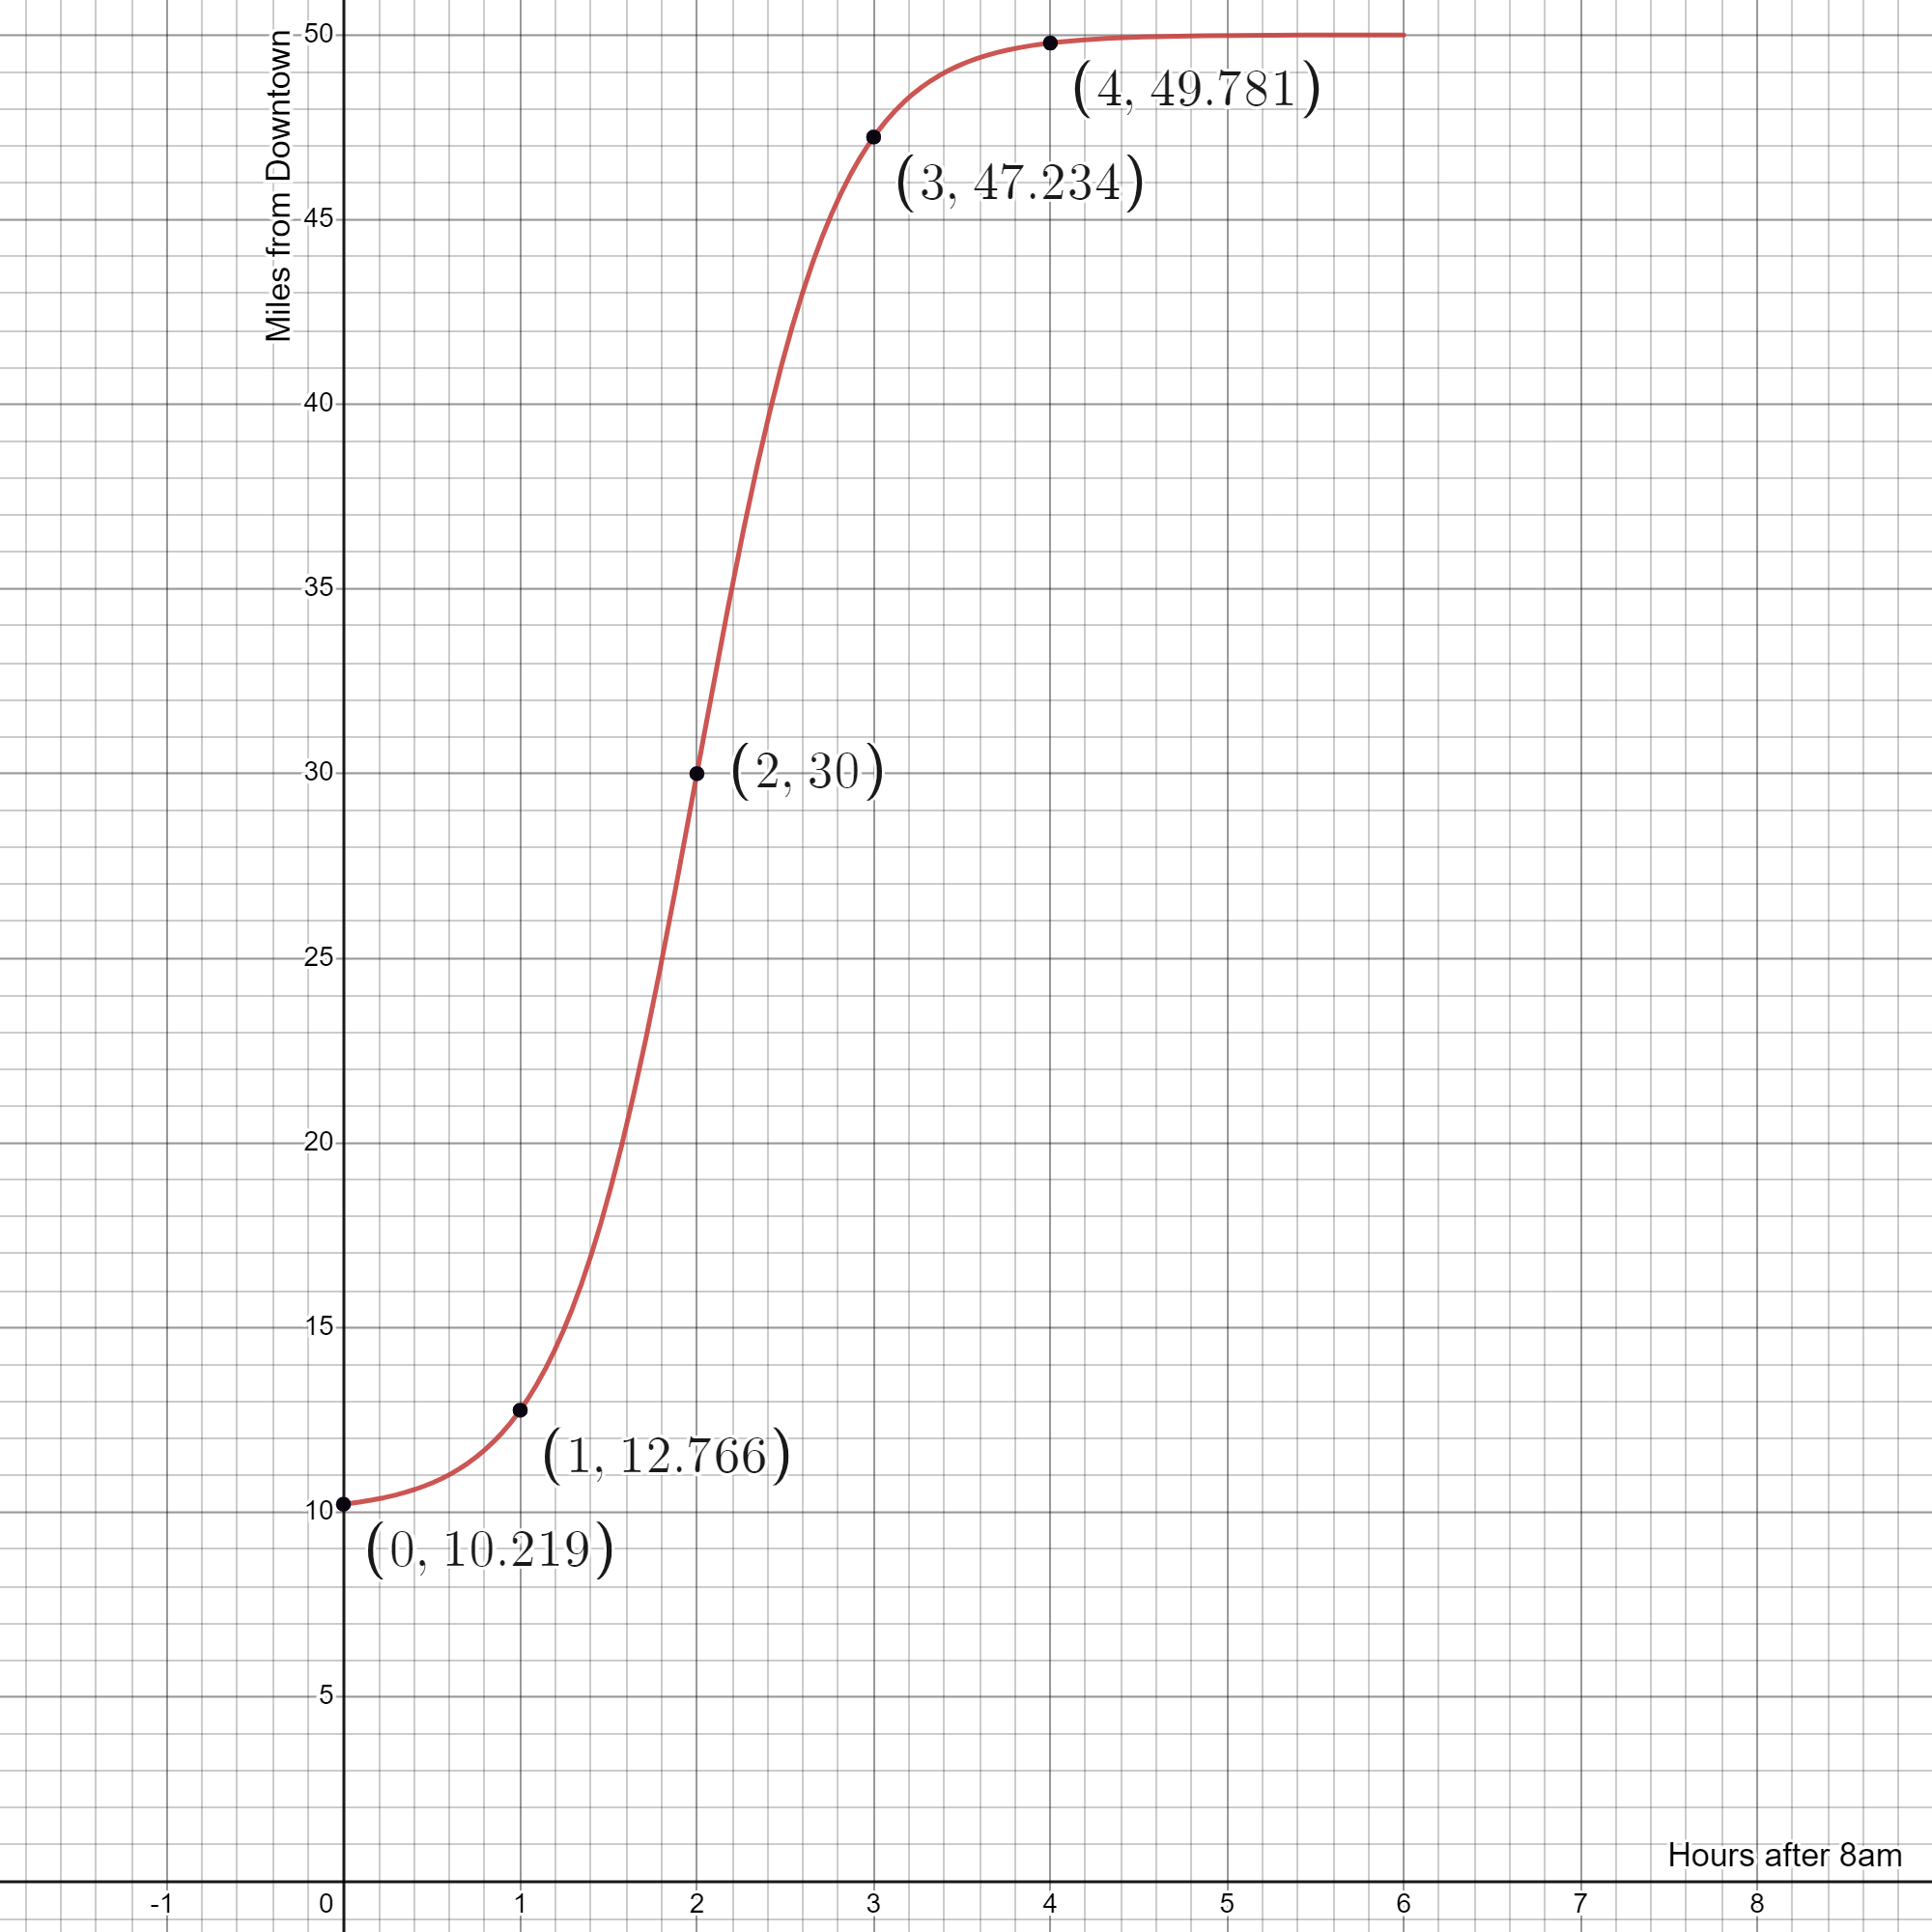
Consider the graph below. The dot on the graph represents the position of a train at a particular time. The cross-hairs represent the time. Notice that the train’s distance, in miles, from downtown depends on the time, in hours, after 8 a.m.
The math “sentence” above is actually an equation and it uses function notation to express the information about the train’s position at a particular time.
In math we don’t really have subjects or verbs or objects. Instead we have input values (numbers) and we have output values. The function is the “machine” or the rule that tells us how to use the input to make an output.
Variables are used to represent values we don’t know or that may change. For a function, the input is called the independent variable, and the output is called the dependent variable. This is because the output depends on the input.
The distance from downtown is constantly changing with time, so we can let the dependent variable \(D\) represent the “Train’s distance in miles from downtown”. Similarly, we can use the independent variable \(t\) to represent the “number of hours after \(8\) a.m.”.
Typically, we use variables that have something to do with the context of the problem, but sometimes we generalize an expression or equation with \(x\)’s and \(y\)’s when we have nothing specific in mind.
If the variables represent actual things or events, we must define them to include the units we used to measure the event. This allows us to extract meaning from the values or expressions.
If you know Spanish you can interpret the meaning of a Spanish article you read by translating it into English. Likewise, if you know “math”, you can interpret the meaning of function notation by translating it into English, provided you know what the variables in the notation mean or what they are measuring.
Since the position of the train depends on the amount of time that has passed, we say “the distance depends on time”. More specifically, we say that the distance of the train from downtown is a function of time.
Function notation allows us to communicate that distance is a function of time by simply writing \(D = f(t)\text{.}\) The notation \(f(t)\) is read as, “\(f\) of \(t\)”.
The word “function” usually refers to the actual rule which turns the input into the output. Sometimes, however, we will use it to describe the output of the relationship.
Function notation like \(f(t)\) or \(f(x)\) or \(f(\text{anything})\) implies there is some kind of relation, some kind of rule, that takes a piece of information and returns a response or result. The format of function notation works on the basic principle of input and output and we often use the notation when we refer to things we don’t yet know.
For instance, if you work as a health assistant, you probably earn some hourly salary and you probably work some number of hours each week. I have no idea how many hours a week you work and no idea how much you earn. But I do know your weekly salary is related to the number of hours you work. In fact, your weekly salary is a function of the number of hours you work.
If \(t\) is the number of hours you work and \(S\) is your weekly salary, I can use function notation to say \(S = f(t)\text{,}\) where \(f\) is the function, the instructions, that calculates your weekly salary. If you work \(12\) hours, then \(t = 12\text{,}\) so \(f(12)\) is your weekly salary for working \(12\) hours.
Notice I still don’t know what the salary actually is, but I can use function notation to talk about it. The expression \(f(12)\) literally means, “whatever you earn when you work \(12\) hours.”
In our train example we chose some input, a time, and the function gave us an output of distance. The notation tells the reader what the input is by showing it in the parentheses:
On the other hand, \(f(0)\) represents an output. It is “the train’s distance from downtown, \(0\) hours after \(8\) a.m.” But we don’t know what that distance actually is yet. In this case, the notation \(f(0)\) means “Whatever the distance is at t = 0”.
The graph below is a function that illustrates a train’s distance from downtown, in miles, as a function of time in hours after \(8\) a.m. When using a graph the best you can do is estimate. Since \(f(0)\) represents a distance at \(8\) a.m., we can use the graph to find what the distance is.
Let \(V = f(A)\) be a function in which the input is the area of a house (measured in square feet), and the output is the value of the house in dollars. Consider the equation \(f(900)=209700\) The notation gives us information about the house. Given \(f(900)=209700\text{,}\)
Pressure at the surface of the ocean is about 14.6 lb⁄in2 (pounds per square inch). If you dive under water \(20\) feet the pressure is about 23.6 lb⁄in2. That’s an average rate of pressure increase of about 0.45 lb⁄in2 pounds per square inch, per foot underwater.
In each example there is a function that relates an input with an output. When the input changes by some amount, the output will also change (though usually by some other amount).
Be careful to remember that we are only talking about an average. For instance, no one can drive from Portland to Seattle at a constant speed. There is always stop and go traffic, variations in speed limits, etc.
As the time changes along the horizontal axis the result is the changing position of the train measured on the vertical axis. The key word here is “change”
In math we use the Greek letter \(\Delta\) to mean “change in”. Change between two values is typically measured by subtracting an old value from a new value.
In our train story where \(D = f(t)\text{,}\) the expression \(\Delta f\) means “change in miles from downtown”. As the train travels away from downtown, the distance from downtown increases. New distance is greater than old distance, so traveling away from downtown is a positive change in distance.
However, the distance from downtown decreases as the train travels towards downtown. New distance is less than old distance, therefore traveling toward downtown is a negative change in distance.
Subsection5.1.5Three Representations of a Relationship
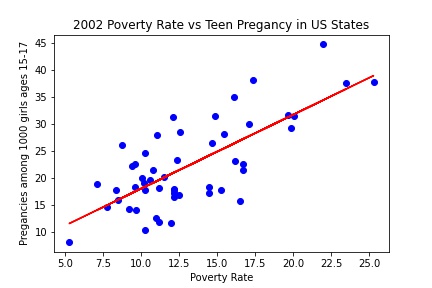
In 2002, the poverty rate of each state in the United States of America (plus D.C. and Puerto Rico) were recorded, as well as the number of births performed by teenage mothers ages 15-17. The data is plotted below, along with a trend line of best fit.
The units for the \(x\)-axis are people below the poverty line per 100 people in each state or territory. The \(y\)-axis is measured in births per 1000 girls ages 15-17 for each state or territory.
A graph provides a visual representation of the situation. It helps you see how the variables are related to each other and make predictions about future values or values in between those in your table. The horizontal and vertical axis of the graph should be labeled, including units.
\begin{equation*}
T = 1.3733 \times P + 4.2673
\end{equation*}
This is an equation for a model. This equation is useful because it can be used to calculate the expected teen pregnancy rate given a state’s poverty rate. Equations are useful for communicating complex relationships. In writing equations, it is always important to define what the variables represent, including units. For example, in the equation above, \(T \) is in births per 1000 girls ages 15-17, and \(P\) is in people living in a household below the poverty line per 100 people.
Another way that you could have represented this relationship is in a table that shows values of t and B as ordered pairs. An ordered pair is two values that are matched together in a given relationship. You used a table in the last lesson. Tables are helpful for recognizing patterns and general relationships or for giving information about specific values. A table should always have labels for each column. The labels should include units when appropriate.
The values of “Model-Brth15to17” are not the actual values, but instead, they are the predicted values using our equation above. We can compare our predicted values with the actual values by including that column.
In the table above, the last column represents points of our equation (the red line) while the second to last column are the actual numbers (corresponding to blue dots).
The type of equation we looked at for poverty and teen pregnany is a linear equation, or a linear model. Recall that the graph of a linear equation is a line. The primary characteristic of a linear equation is that it has a constant rate of change, meaning that each time the input increases by one, the output changes by a fixed amount. In the example above, if one state as 1 more person per 100 below the poverty line than another state, then we expect the first state to have 1.3733 more pregnancies per 1000 girls 15-17 years old. This constant rate of change is also called slope.
\begin{equation*}
\frac{\text{change of output}}{\text{change of input}}
\end{equation*}
In the graph shown, we can see that the graph is a line, so the equation is linear. We can compute the slope using any two pairs of points by counting how much the input and output change, and divide them. Notice that we get the same slope regardless of which points we use.
If the output increases as the input increases, we consider that a positive change. If the output decreases as the input increases, that is a negative change, and the slope will be negative.
Some people call the calculation of slope "rise over run", where "rise" refers to the vertical change in output, and "run" refers to the horizontal change of input.
The units on slope will be a rate based on the units of the output and input variables. It will have units of "output units per input units". For example,
where \(m\) is the slope, and \(b\) is the vertical intercept (called y intercept when the output variable is \(y\)). In the equation, \(x\) is the input variable, and \(y\) is the output variable.
Evaluate, apply and interpret function notation, including the notation for inverse functions and composition of Functions
1.
The function W(h) represents the average weight (measured in pounds) of 60 year old American men as a function of their height (measured in centimeters). Suppose \(W^{-1}(181)=180\text{.}\) Explain what this means in a complete sentence.
Let \(I=f(T)\) and \(H=g(T)\) be two functions that return \(I\text{,}\) the number of ice cream bars you sell at your food cart in one day, and \(H\text{,}\)the number of hot coffee drinks you sell at your food cart in one day. Let \(T\) be the average temperature outside in degrees Fahrenheit.
If you charge \(\$2.50\) for an ice cream bar and \(\$1.75\) for a hot coffee drink, write an expression (using function notation) that represents the total amount of money you will make from coffee and ice cream in one day, if the average temperature outside is \(80\) degrees.
Explore their profit (the amount they bring in from sales minus costs) using graphs and/or tables. Use these to estimate how many shirts the team will have to sell to reach their goal.
Suppose you and your roommates need to move, so you look into renting a moving truck for the day. U-Haul (www.uhaul.com) charges the following amounts for three different trucks. The dimensions for the trucks are given in length x width x height.
$19.95 plus $0.79 per mile for a cargo van with inside dimensions: 9’2" x 5’7-1/2" x 4’5"
You estimate that you and your roommates have three rooms full of furniture and boxes, equivalent to about 1,000 cubic feet. Your new apartment is about 10 miles (one way) from your old apartment. As a group, decide which vehicle size is a better deal to rent. Provide work to support your answer.