Section 4.6 Worksheet Measures of Central Tendancy and Variation
Worksheet In Class Activity for Section 4.4 and Section 4.5
Halloween Data.
A data scientist has been counting the number of trick-or-treaters that come to his house every year. We will analyze the shape, center and spread of this data. Source: https://www.dataplusscience.com/HalloweenData.html
1.
Make a histogram of the number of trick-or-treaters using a bin-width of 100 trick-or-treaters. Save room to make a boxplot right below it, but not yet. Follow the steps in order. Label your axes.
If you are doing this in class, then actually draw the histogram (and later, the boxplot) by hand. If you are doing this online, then space has been provided to copy and paste them below. A great resource is https://www.statskingdom.com/histogram-maker.html
| Year | 2008 | 2009 | 2010 | 2011 | 2012 | 2013 | 2014 | 2015 | 2016 | 2017 | 2018 | 2019 | 2020 | 2021 | 2022 |
| Number of Trick-or-Treaters |
492 | 542 | 726 | 869 | 673 | 391 | 454 | 747 | 822 | 776 | 600 | 523 | 219 | 487 | 512 |
2.
What is the shape of the histogram? If you are not sure yet, answer the next question, then come back to this one.3.
Find the mean, median and mode, include units.4.
Find the 5-number summary, IQR and range, including units.5.
Use the 5-number summary to draw a boxplot above. Make your horizontal scale match your histogram scale.6.
Do you think there are any outliers? Why or why not?Comparing Distributions.
Below are fictitious student test scores from a MAT-1185 quiz in two different classes. You will be making a boxplot for each to compare their distributions.
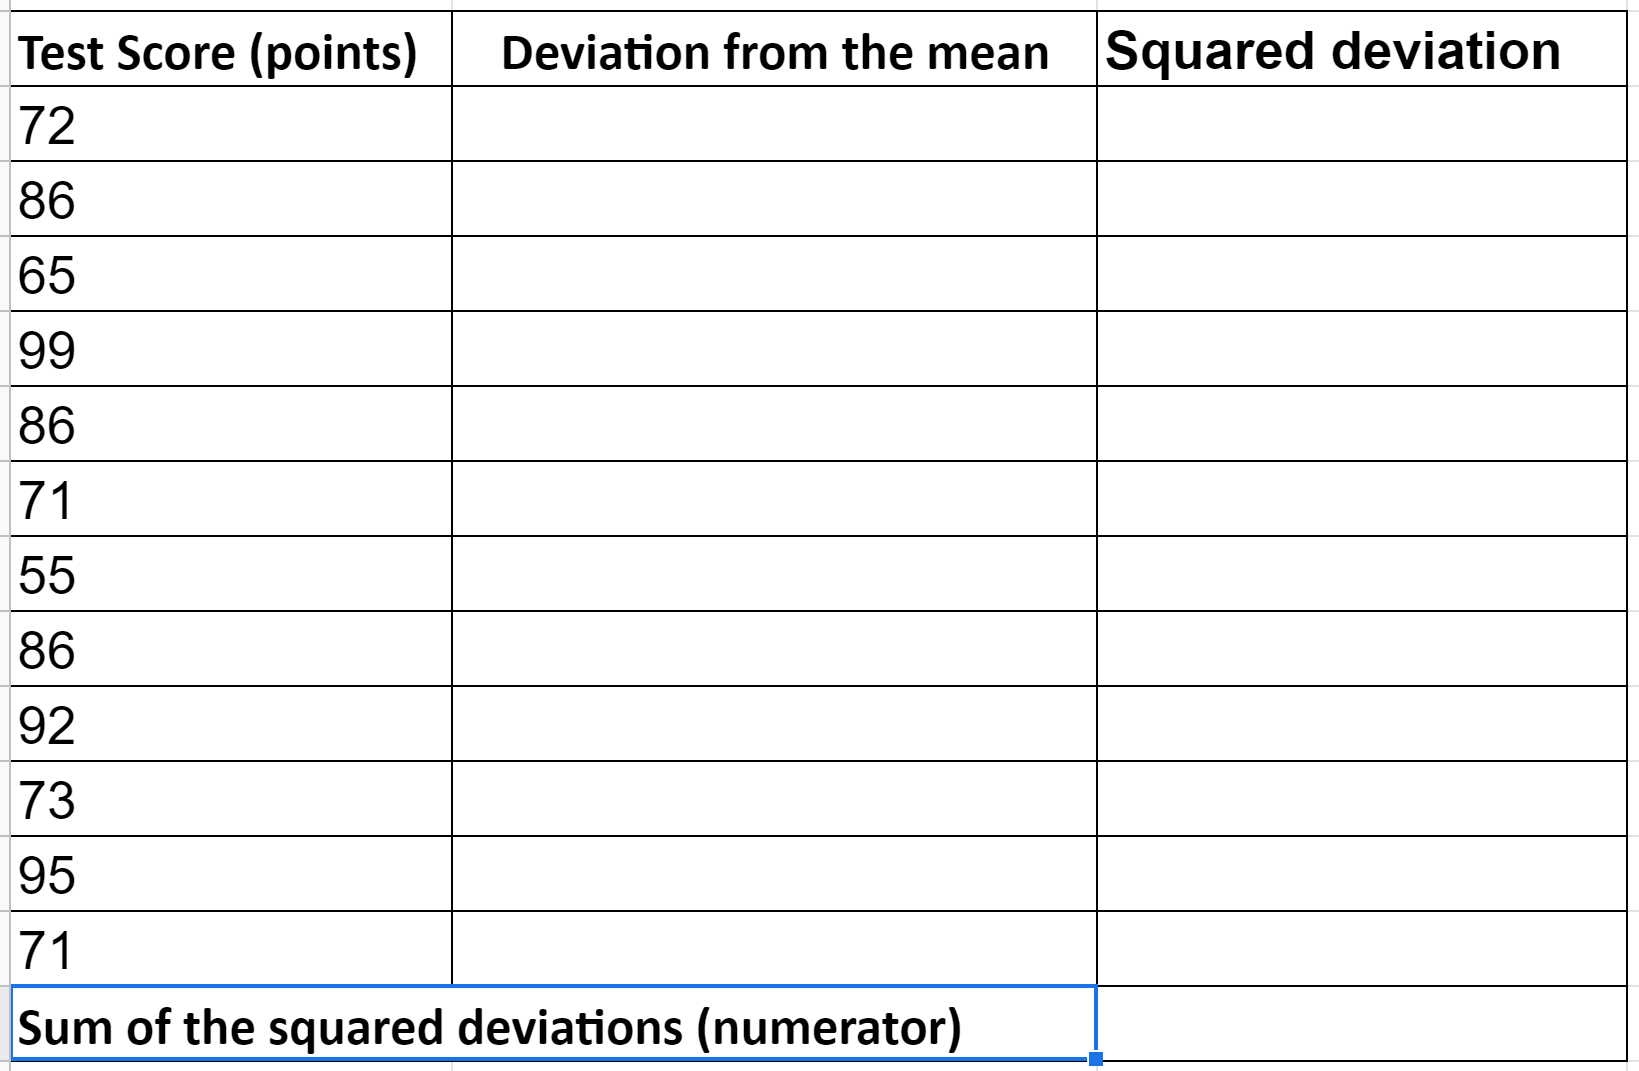
Class 1: 72, 86, 65, 99, 86, 71, 55, 86, 92, 73, 95, 71 points
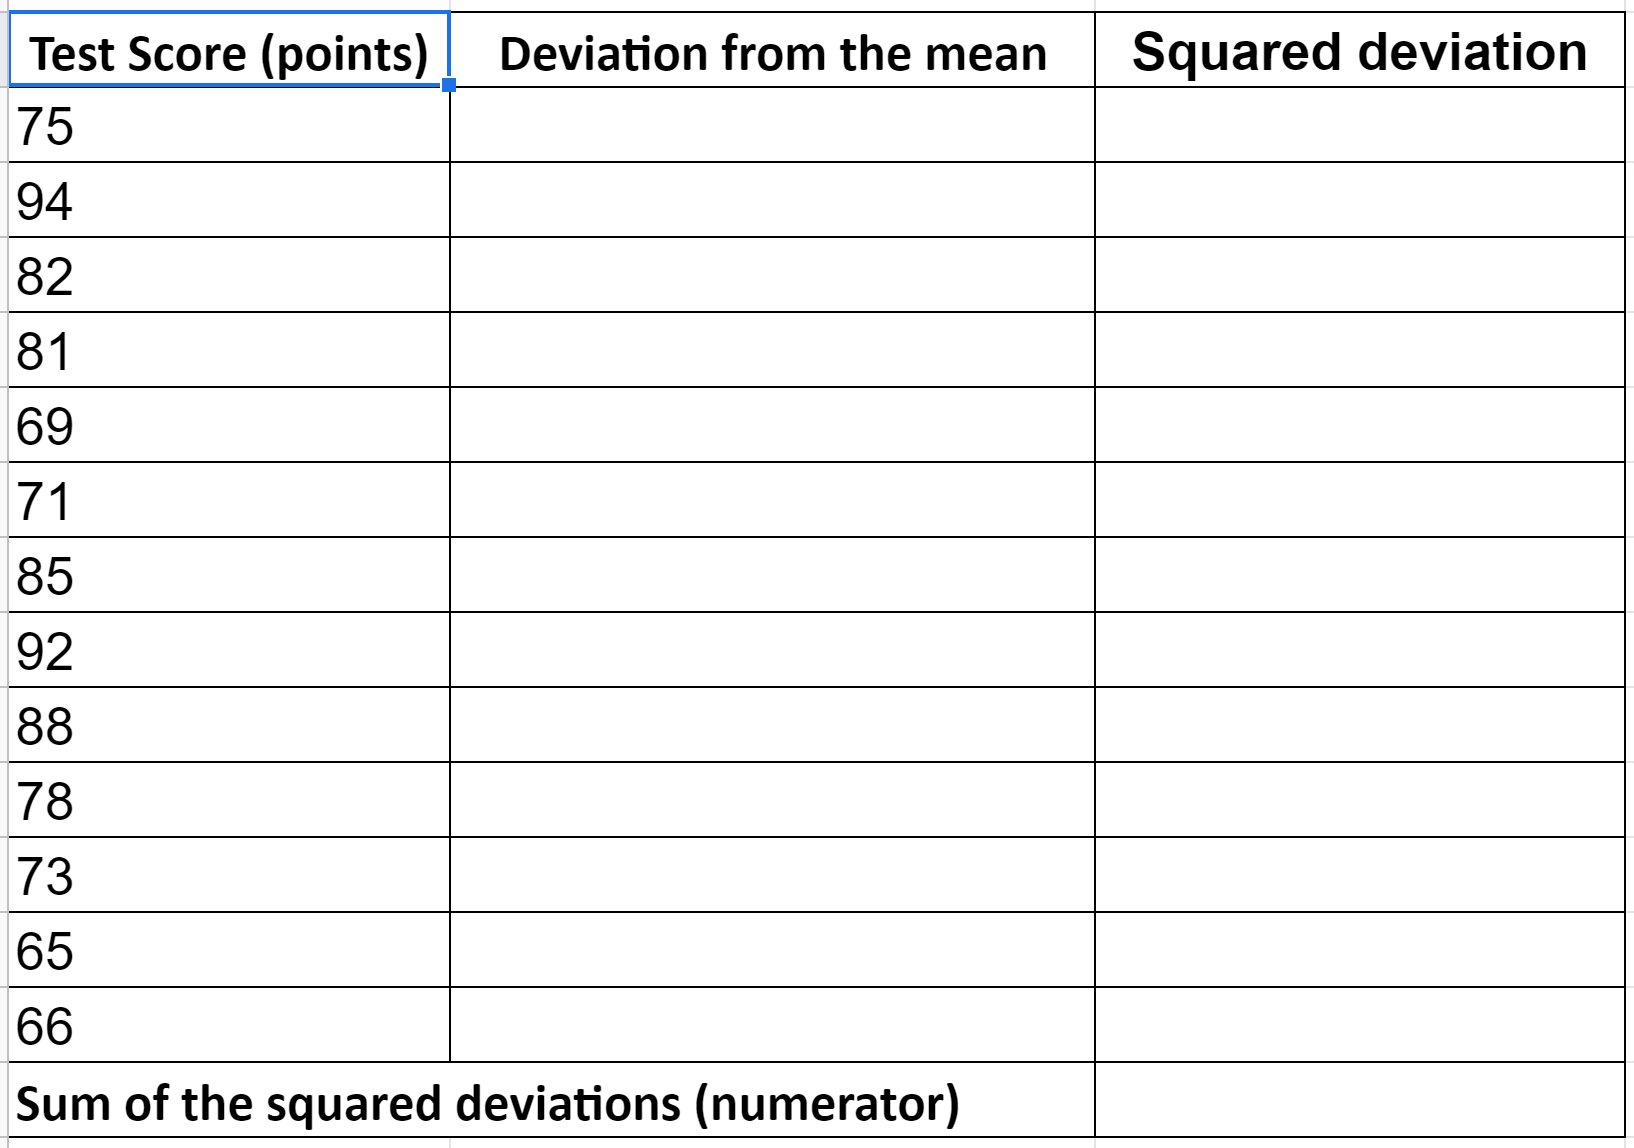
Class 2: 75, 94, 82, 81, 69, 71, 85, 92, 88, 78, 73, 65, 66 points
7.
Find the mean, 5-number summary, IQR and range for each class, including units.8.
Draw the boxplot for each class using the same scale.9.
What is the shape of the data for each class? How can you tell?Calculating Standard Deviation, \(s\).
10.
Using your means rounded to one decimal place, find the standard deviation for Class 1, including units. The variable n refers to the number of data values.
Mean = n =
11.
Using your means rounded to one decimal place, find the standard deviation for Class 2, including units. The variable n refers to the number of data values.
Mean = n =